What is a Log Management System
A log, in a computing context, is the automatically produced and time-stamped documentation of events relevant to a particular system. Virtually all software applications and systems produce log files.
Log management is the collective processes and policies used to administer and facilitate the generation, transmission, analysis, storage, archiving and ultimate disposal of the large volumes of log data created within an information system.
Log management software automates many of the processes involved. An event log manager (ELM), for example, tracks changes in an organization’s IT infrastructure. These changes are reflected in audit trails that must be produced for a compliance audit.
Why is a log management system important to affiliates
We analyze logs to make sense of events, properly detect patterns, anomalies, and help users make data-driven decisions. Logs can be filtered based on text patterns, tagged and categorized, and correlated from different sources to see all pertinent information to a certain event. Log analysis helps connect the dots between the network, infrastructure, server, application framework, and user behavior to better understand what is broken and give a comprehensive view across all activity, across all sources, servers, and locations. Log analysis helps identify potential issues and threats, do root cause analysis and mitigate risks. It also feeds into log monitoring, alerting, security, audits, and regulatory compliance. Teams that need to search through vast volumes of logs will require a fast and simplified process to find all the information they need to debug an incident, jump to the right timeline, and solve issues. With modern cloud applications producing gigabytes or terabytes a day, the log management tool must be able to centralize all logs and retrieve data within seconds. It’s also important for your tools to have a user-intuitive dashboard and support natural search.
How to choose the best log management system
It’s important to get a log management solution that works well with your company’s unique needs and helps empower your business to work more efficiently. There are a few different types of centralized log management platforms.
The ELK stack has been downloaded millions of times and is the most popular log management platform if your organization is willing to deploy and manage these open source projects on your own.
There are also SaaS cloud logging providers like LogDNA, Sumologic, and Logz.io that let you quickly send, live-tail and analyze your logs in a centralized easily accessible place on the cloud within minutes.
10 Components to Look For In Your Ideal Log Management System
- Use a framework with flexible output options
- Utilize standard format like JSON
- Visualization of console logs without direct server access
- Custom format for storage outside your data center
- User experience intuitive for all users
- Low latency for live monitoring
- Test search performance at full query capacity
- Ingestion time less than a few seconds
- Automatically parsed logs at ingestion
- Easy onboarding and integration for pre-existing systems
Introduction to Papertrail
Papertrail is a system that aims to take the headache out of managing safety compliance and inspections and helps save businesses time and money. The web-based software with iOS and Android apps is available for businesses regardless of their size and helps in efficient management of health and safety requirements.
It allows creating and managing hundreds of records with ease and in very less time compared to manual input. Entire safety inventory, to-do lists and inspection records can be easily added and managed using a single platform. It allows scheduling mandatory inspections by recording and sharing useful information with the concerned teams. It enhances accountability by assigning responsibilities and making sure that everyone knows what they are supposed to do and what they are actually doing. Folder access can also be restricted, making it easier to manage users and teams.
Benefits of Papertrail
Mobility is software’s biggest advantage as it allows users to update their safety records from anywhere using their mobile devices. The iOS and Android apps also work offline and feature RFID and barcode scanning as well as location and photo services. The apps help the users to capture all the important data they need to keep operations running smoothly.
The inspection reminder and notification system automatically reminds users when inspections are due and sends notifications on a daily, weekly etc. basis. The inspection system allows quick access to safety equipment inventory and other important data for safety management and audit purposes. Reporting and analysis is an important part of any safety and inspection system and Papertrail allows quickly and easily generating reports, certificates and printouts. These documents provide the evidence businesses require for inspections and safety compliance.
Compared to traditional paper-based records and spreadsheets, the software makes the whole process of safety compliance and inspections easier and more efficient. Instead of setting calendar reminders for many lists, a simple email notifies of all items due for inspection and allows taking action right from there. The solution works well for many kinds of industries, including healthcare, telecom, adventure, emergency services and PPE inspectors. The mobile apps help save time and money by allowing users to stay updated in real-time and streamlining operations.
Features
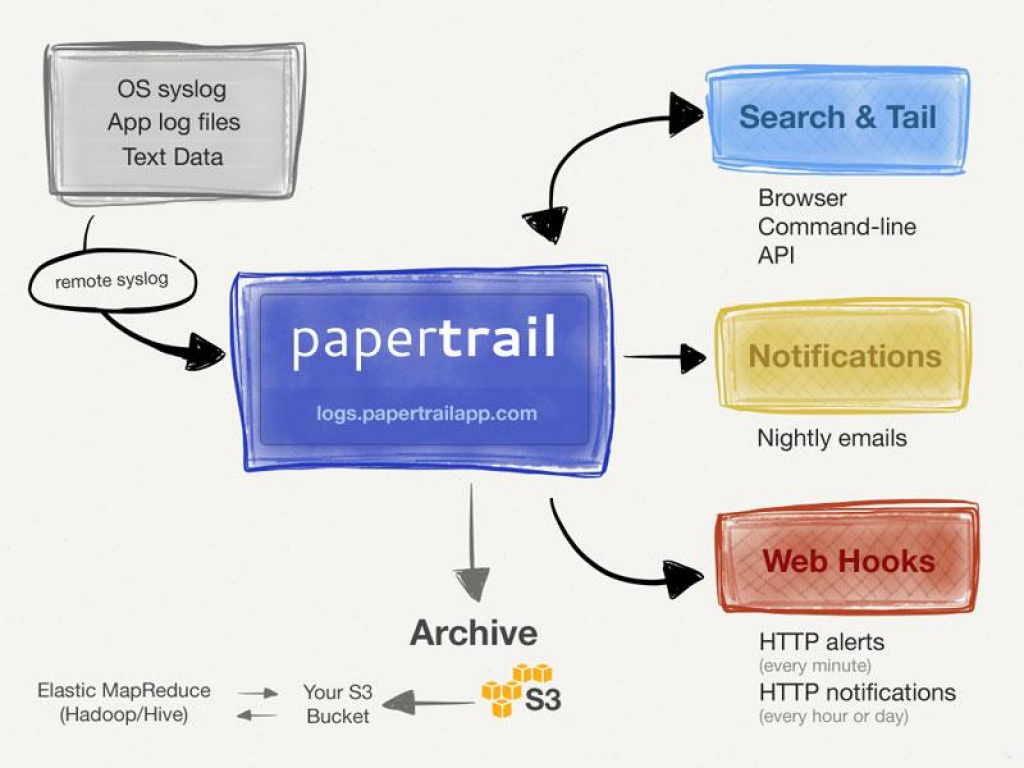
- Aggregate: All app logs, text log files, and syslog. One place.
- Tail & Search: It’s realtime. Use a browser, command-line, or API.
- React & Analyse: Get alerted instantly. Detect trends and archive.
- Lightning Search: Search hours of logs typically in seconds.
- Fast Setup: Easy to implement, use & understand. Get visibility across all systems, typically in minutes.
- Integrate & Archive: Work with common, powerful existing services.
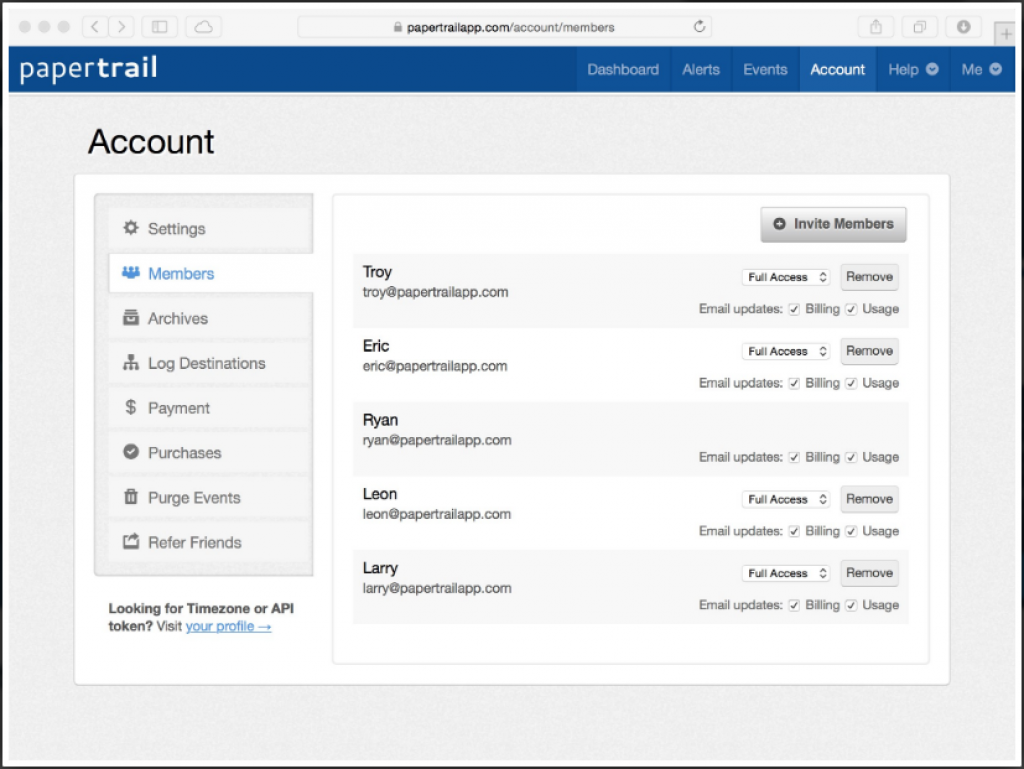
- Team Visibility: Less technical staff can view logs without any SSH/RDP knowledge or access.
- Log Velocity Analytics: Troubleshoot a spike in the last 10 minutes or spot trends over the last two weeks.
Logs Papertrail aggregates
- syslog
- Text log files
- MySQL
- Cloud hosting
- Apache
- Routers & firewalls
- Ruby on Rails
- Windows events
- Tomcat
- Heroku apps
Dashboard Details
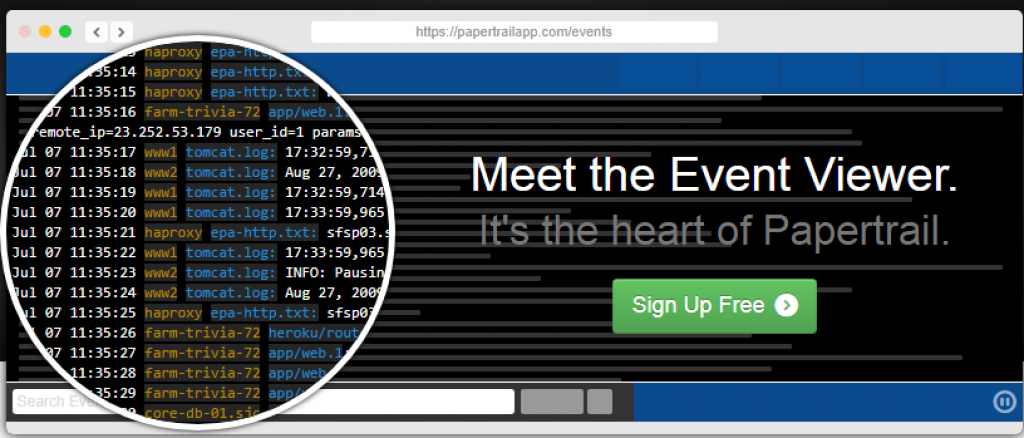
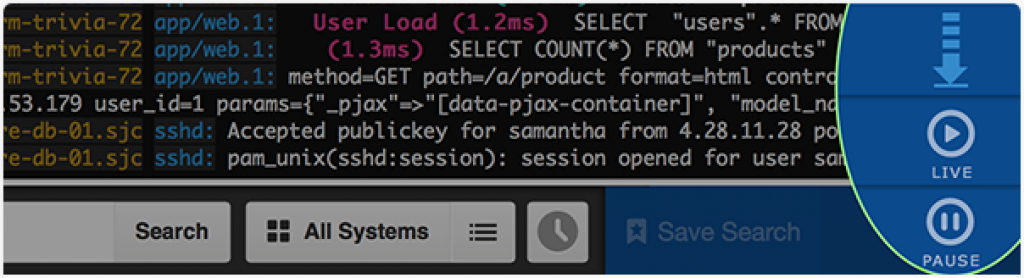
LIVE TAIL
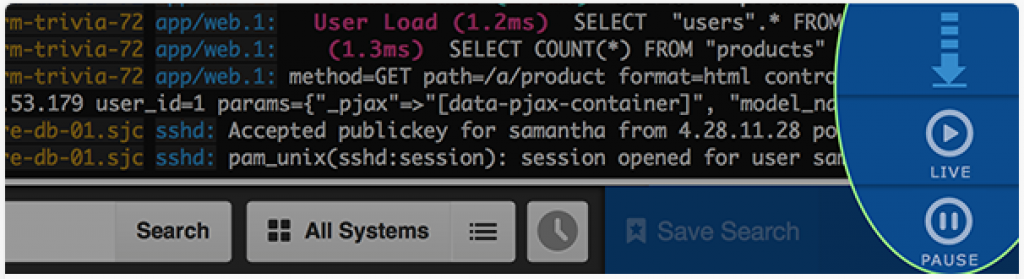
Papertrail’s event viewer is realtime. When using Papertrail, we appreciate that it:
- feels communicative: Imagine “tail -f” on dozens of systems, but with pause, search, infinite scroll, alerts, and clickable log elements like IP addresses, UUIDs, and user IDs.
- stays out of the way, so it’s there when we need it and not asking for my attention when we don’t.
- plays well with browser. We expect new tabs, scroll indicators, and copy-and-pasted URLs to work the way they do in other Web sites.
These might sound simple, but they aren’t, and nuance matters. The fact that we “sweat the details” as Papertrail’s creators make a huge difference for us as users.
SEEK BY TIME
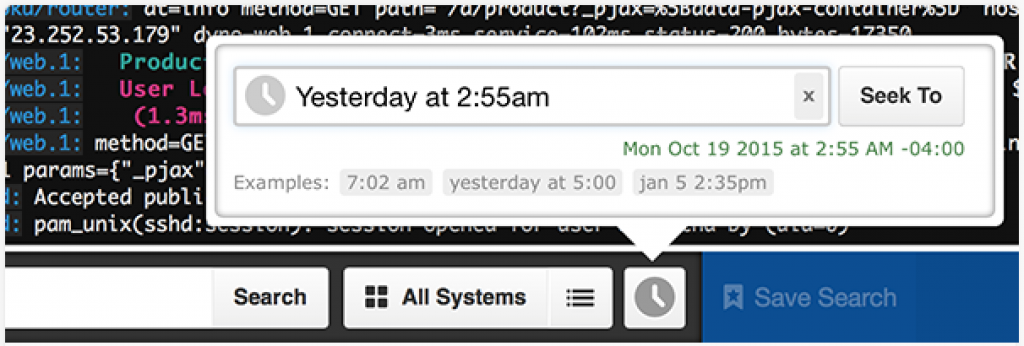
Whole books have been written about coordinating time among distributed teams. As a distributed team ourselves, Papertrail lets us:
- jump to a specific time (in 2 clicks).
- use our personal time zone, regardless of what our systems use. Since Papertrail staffs are in different time zones, local-to-the-person log timestamps are ridiculously convenient.
- receive alerts and summaries in a team-wide timezone, so we’re all working from the same notification.
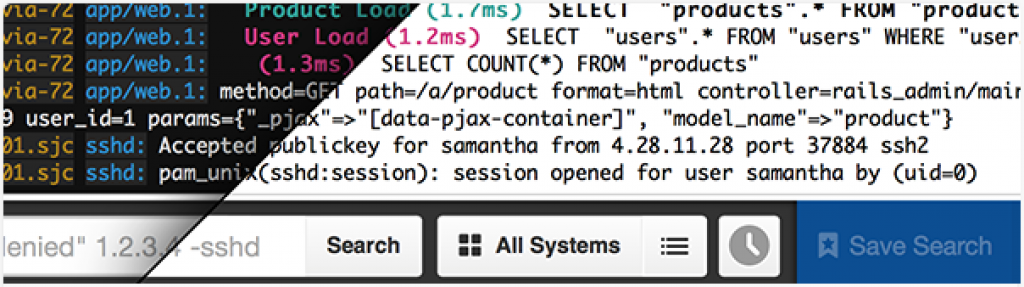
CONTEXT
Papertrail’s viewer shows links to see any message in context. Click the sender (orange) or program (blue) to jump to that message within the related stream. Click the plus sign (+) for additional context choices or to transition to the command-line.
If you haven’t tried context links yet, here’s 3 situations where they’ve helped us:
- Infrastructure-wide history. While viewing an HTTP request log for a user-facing error, clicking access_log shows all Web requests. Because other Web servers in the group are also searched and the query (like an IP address or user ID) is preserved, Papertrail returns the end-to-end history.
- Single-system impact. After spotting a kernel problem in a Unix syslog message, clicking the sender will show events from only that system.
- Long events, like when a search matches one line in a multi-line exception. Click the log sender to see it all.
If you’re used to grep, we’ve tried to adopt the best parts of its context and jettison those that we didn’t use.
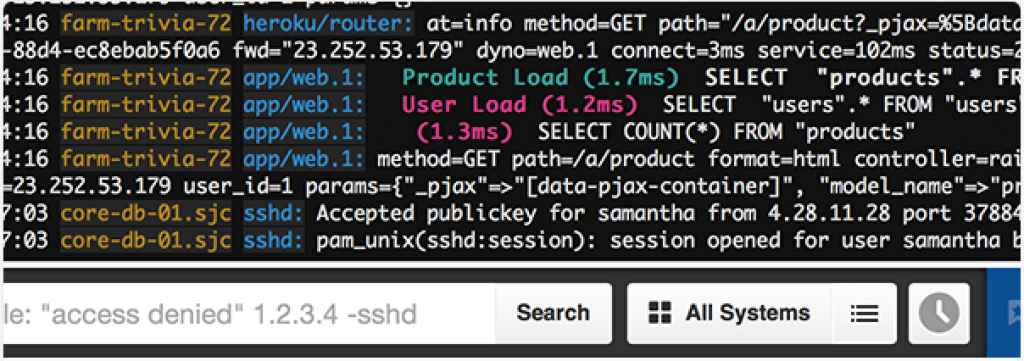
ELEGANT SEARCH
Papertrail’s event viewer is live and searchable at the same time. Like Google or Gmail, absolutely everything is searchable.
As we filter the event stream with searches, new logs still appear in realtime. This has been handy when we’re trying to reproduce problems. We’re not forced to choose between older search results or live logs. We get both.
Exclusion searches like -noise made it fast for us to filter out routine events. Papertrail’s alerts email us when something else – by definition, an unusual event – occurs.
APM INTEGRATION
Out of the box integration between Papertrail and Solarwinds AppOptics lets you easily transition from a distributed trace into a view of the corresponding logs.
- One-click to drill down from a trace to the relevant logs
- Shared Trace ID cuts through the noise and isolates the event messages for a specific request
- Simple setup AppOptics auto-instruments the application and inserts the trace ID into the logs. Papertrail event viewer displays events with a matching trace ID.
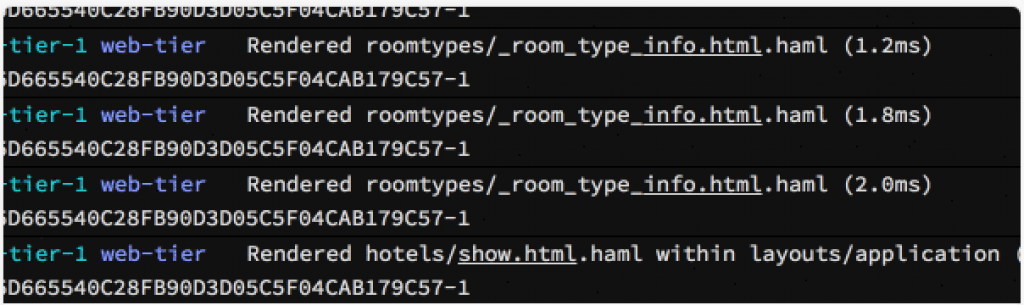
SKIM-ABILITY
A few parts of Papertrail’s event viewer make it a particularly rewarding way to read or skim logs.
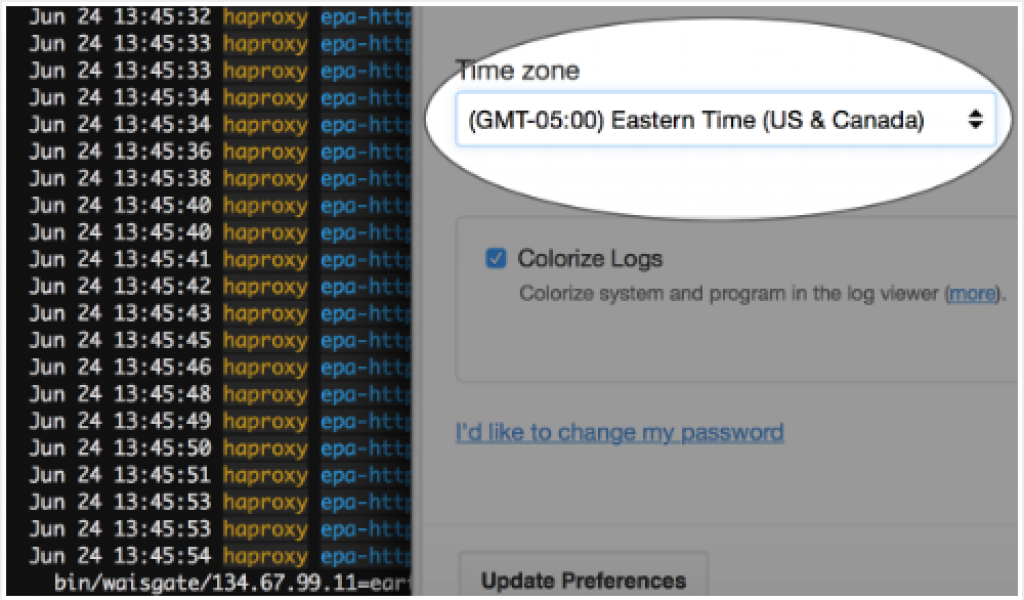
- ANSI color support to colorize log messages and make it easier to spot what you are looking for while making it all look beautiful.
- Contrast that’s controllable to suit your tastes and the ambient lighting.
- Scrolling as one way to travel through time. As you scroll, the viewer automatically shows older or newer logs. It’s a great way to “poke around.”
- Information density: Papertrail’s viewer doesn’t show a zillion pieces of metadata merely because they exist. It’s an opinionated view with wise, battle-tested opinions.
SAVED SEARCHES
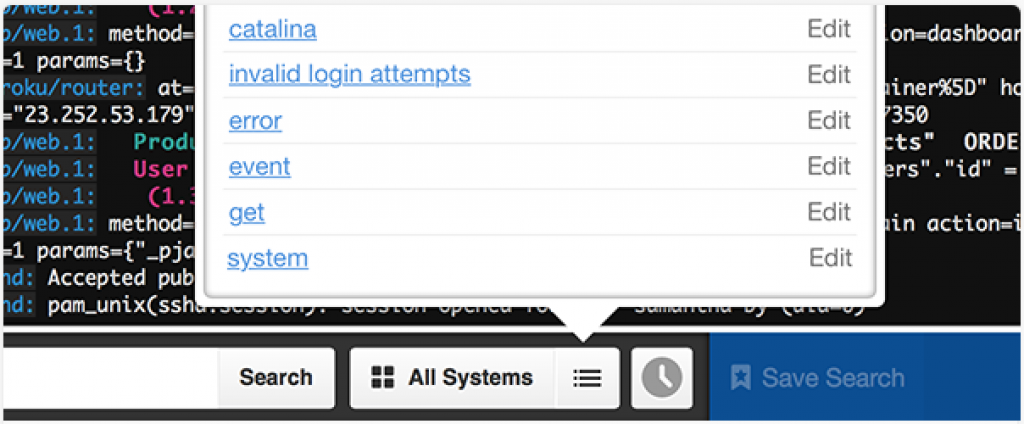
Not all of us here are blessed with elephant-like memory-in all areas, at all times. When we find a particularly useful log search, it’s worth saving.
Saved searches are available without leaving the event viewer. Between search queries and groups (of log senders), the viewer is a one-click path to any subset of our logs.
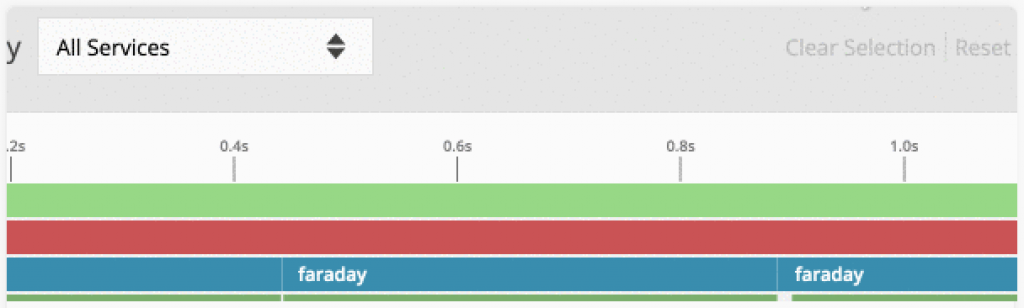
LOG VELOCITY ANALYTICS
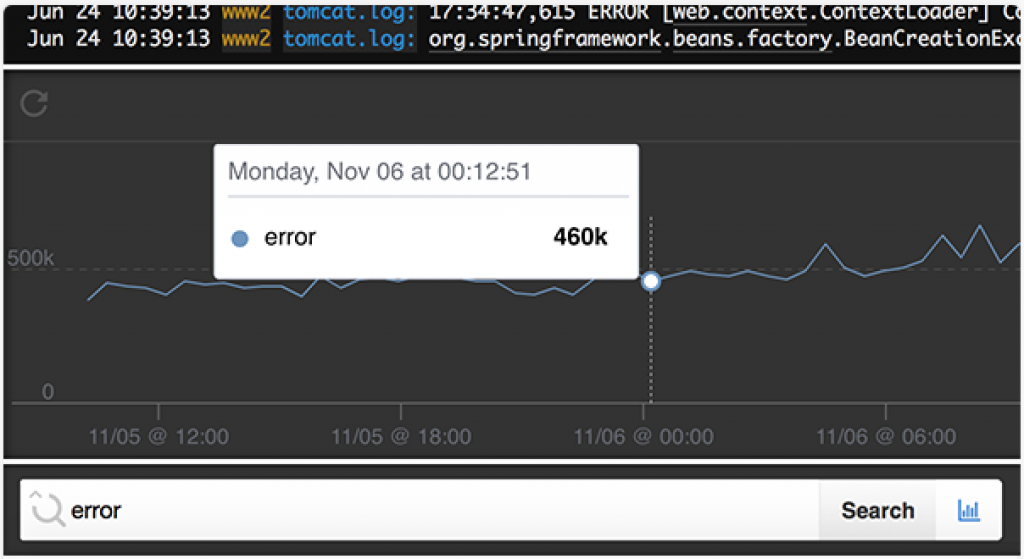
We always have “How often does this happen?” questions we want answered.
Log Velocity Analytics provides a quick visualization of log throughput for new or saved searches. It helps identify patterns or anomalies, further reducing the time to troubleshoot errors.
- Troubleshoot a spike in the last 10 minutes
- Spot trends over the last two weeks
- Jump to a specific time (in two clicks)
Pricing- Free trial and Plans
Papertrail has a free trial period of 7 days with 48 hrs of search limit at $0 with no credit card details needed, which is a great start for beginners. The other plans included are:
| $7 | $18 | $35 | $75 | $150 | $230 |
| 1 GB/month | 2 GB/month | 4 GB/month | 8 GB/month | 16 GB/month | 25 GB/month |
| SEARCH 1 week | SEARCH 1 week | SEARCH 2 weeks | SEARCH 2 weeks | SEARCH 2 weeks | SEARCH 2 weeks |
| ARCHIVE 1 year | ARCHIVE 1 year | ARCHIVE 1 year | ARCHIVE 1 year | ARCHIVE 1 year | ARCHIVE 1 year |
Other than these they also allow users to customize the plans as per their needs and help them to choose from the following features:
- Intuitive Web-based log viewer
- Powerful command-line tools
- Long-term archive (S3)
- Team-wide groups & searches
- Automated export for reporting
- REST API
- Unlimited systems & users
- Encrypted logging
- Search alerts
Also if a user exceeds their limit, Logs can stop or can continue as a usage-based service (up to 200% extra, at 30% higher price per GB). Users are always notified and can switch at any time.
Log transfer (GB) is calculated on the basis of the length of the message, plus 50 bytes for metadata. 1 GB is 6.6 million 100-character messages. Transfer is measured monthly, so day-to-day variations are fine.
loging from my less-common network or app is allowed if it has Internet access. Like those of NAT, dynamic IPs, text log files, VMs, EC2, PaaS, and local collectors.
Archives are downloadable text files and are copied to Amazon S3. Our docs make it simple to analyze and search them: Redshift, Athena, Hadoop on EMR.
Discount Codes
Use code c59d72 and enjoy extra 50 mb/month log volume free.
Alternatives
- Grafana: Grafana provides a powerful and elegant way to create, explore, and share dashboards and data with your team and the world. Grafana is most commonly used for visualizing time series data for Internet infrastructure and application analytics but many use it in other domains including industrial sensors, home automation, weather, and process control.
- logstash: logstash is a tool for managing events and logs. You can use it to collect logs, parse them, and store them for later use (like, for searching). Speaking of searching, logstash comes with a web interface for searching and drilling into all of your logs.
- Datadog: Datadog is a monitoring service for IT, Dev & Ops teams who write and run applications at scale, and want to turn the massive amounts of data produced by their apps, tools and services into a unified view of IT infrastructure. Datadog’s capabilities are provided on a SaaS-based data analytics platform that enables multiple teams to work collaboratively on infrastructure issues.
- Graphite: Graphite is a highly scalable real-time graphing system. As a user, you write an application that collects numeric time-series data that you are interested in graphing, and send it to Graphite’s processing backend, carbon, which stores the data in Graphite’s specialized database. The data can then be visualized through graphite’s web interfaces.
- Splunk: Splunk is software that provides unique visibility across your entire IT infrastructure from one place in real time. Only Splunk enables you to search, report, monitor and analyze streaming and historical data from any source. Troubleshoot application problems and investigate security incidents in minutes instead of hours or days, monitor to avoid service degradation or outages, deliver compliance at lower cost and gain new business insights from your IT data.
Rounding Up
SolarWinds Papertrail is a cloud-hosted log management tool designed for faster troubleshooting of infrastructure and application issues. Papertrail lets you consolidate your logs across your environment in one place and track real-time activity to easily diagnose and fix problems. Features such as log aggregation, tail and search, and proactive alert notifications make Papertrail a frustration-free service providing full and instant visibility across all logs.
Overall Papertrail gives us the ability to monitor devices based on usernames, device ID’s, app versions, iOS versions, etc. Easy SQL searching and parsing. It helps users gain the ability to create different visualizations based on predefined metrics but also allows for some customization and view user logs immediately. Its cheap plans make it a user favorite while selecting a log management tool.